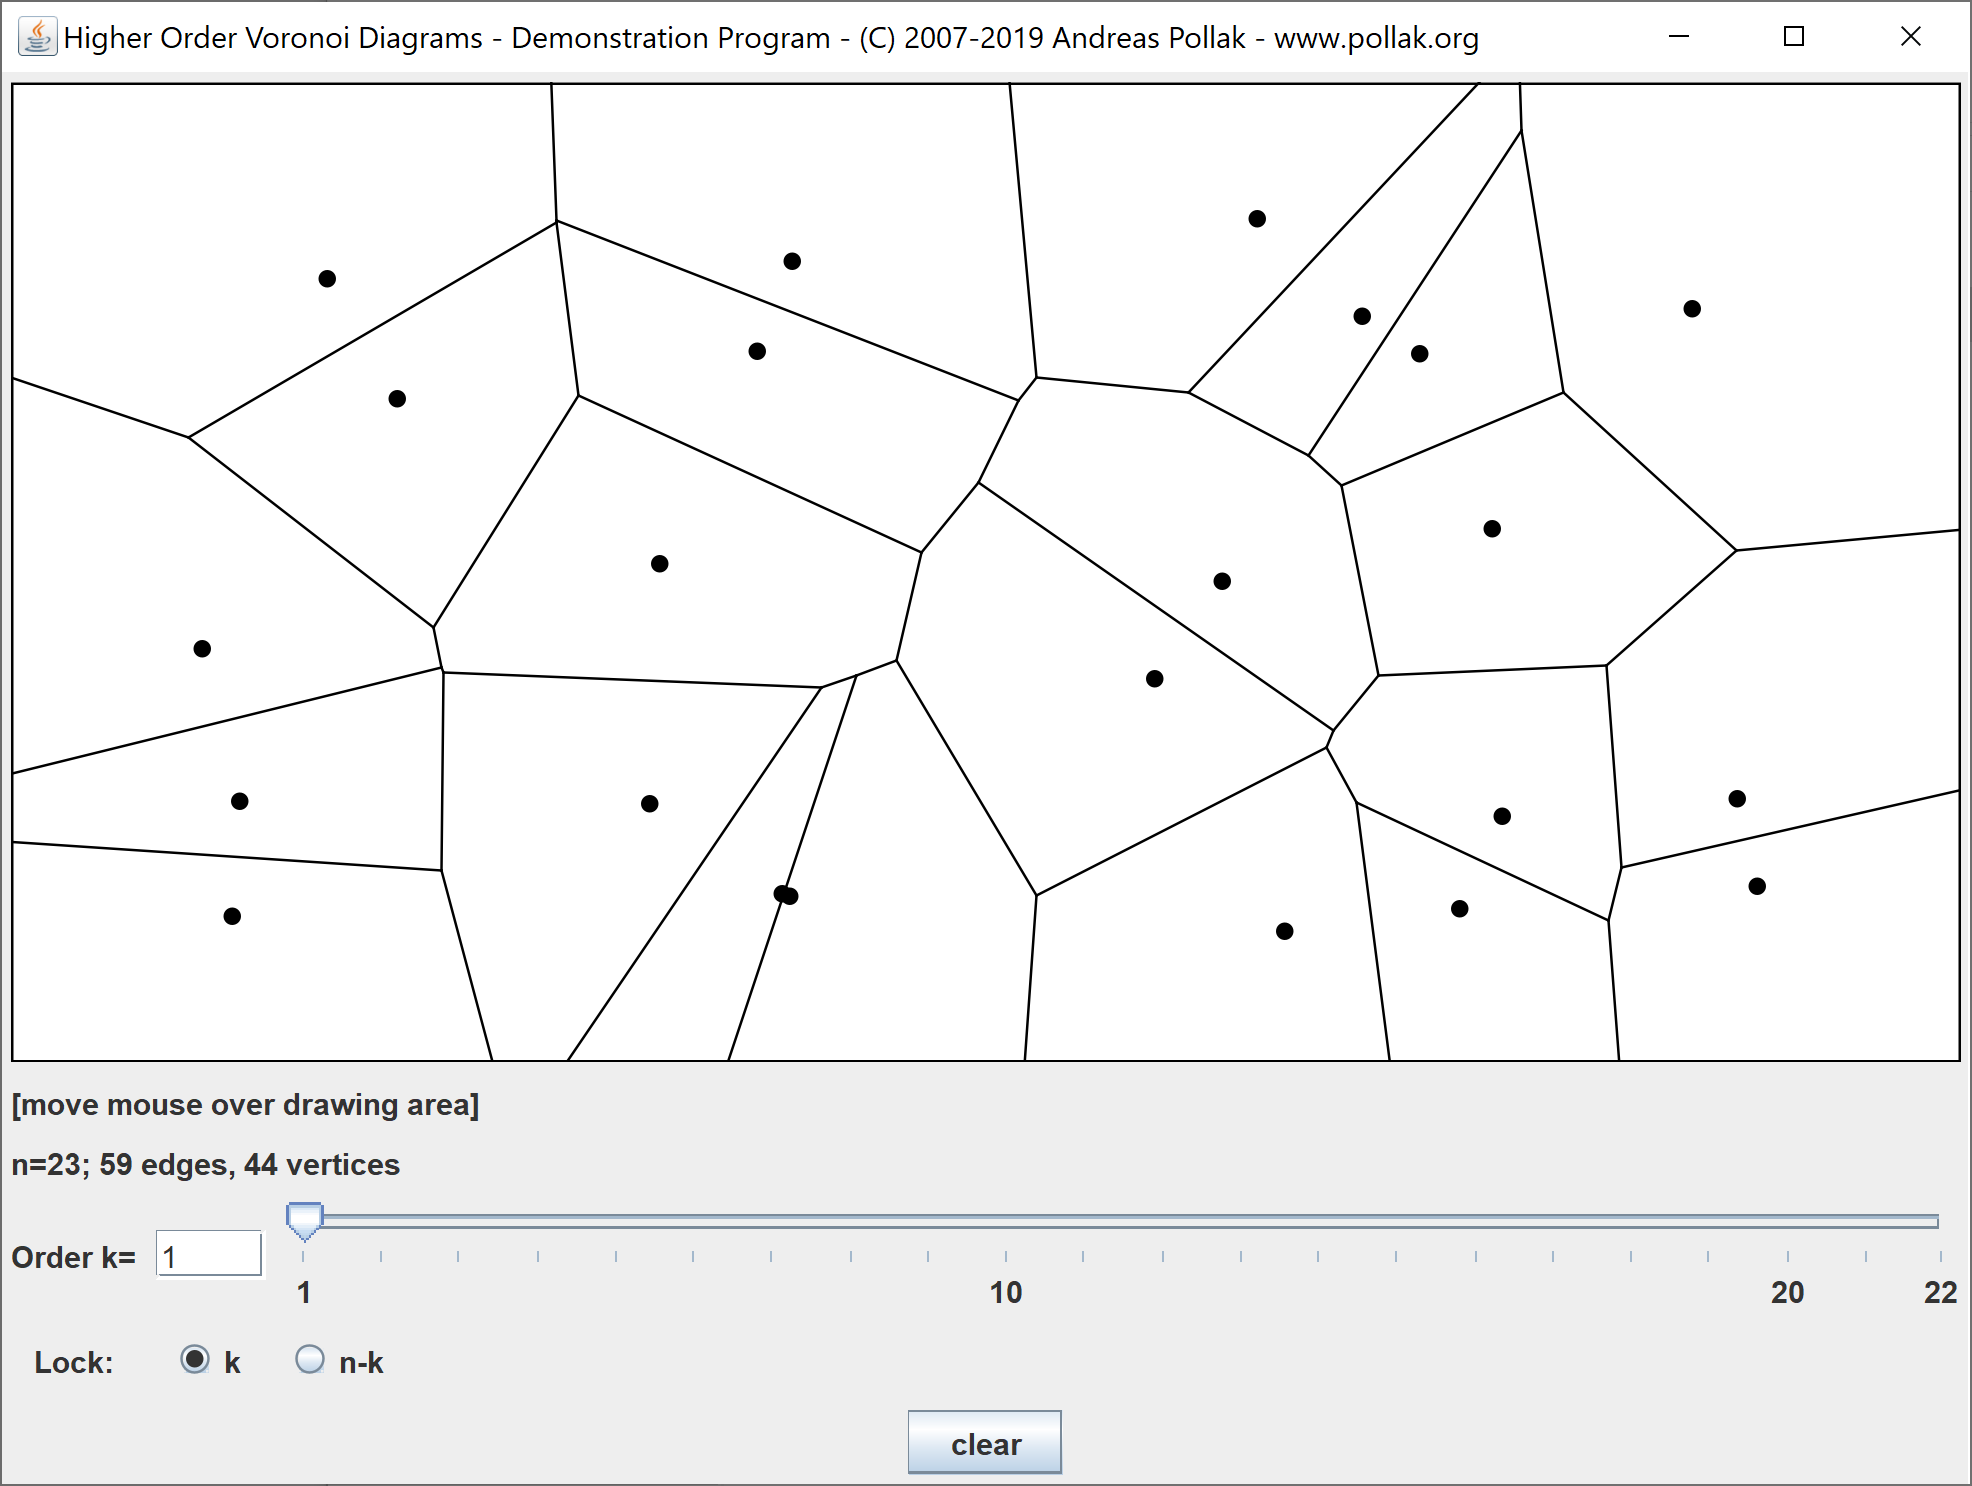
Higher Order Voronoi Diagrams
Demonstration Program
About Voronoi Diagrams
Voronoi diagrams are a particular partition of space based proximity to a given set of points. In the simplest case, the two-dimensional one,
for a set of
n points the Voronoi diagram divides the plane into a total of
n regions, one sourrounding each point
p, such that
p
is the closest point (closest neighbour) from anywhere in this region. Edges that divide these regions have the propery of being equally close to two points,
vertices where edges join have three or more closest neighbours.
Higher order Voronoi diagrams are based closest-neighbour relationships to more then one point (e.g. a - possibly empty - region
in an order-3 diagram would be the area where the closed three neighbours are three particular points). See the literature cited below
or
 Wikipedia
for more information.
This program constructs and visualizes Voronoi diagrams of any order based on a set of points you supply.
The link to download the program can be found below.
If you want to know more about the algorithm used, or if you'd like to get the source code, please
 contact me
.
Use the mouse to add and remove points:
- add a point by left clicking on the drawing area;
- right click or [ctrl]-click on a point to remove it;
- you can use the middle button (or mouse wheel) or [shift]-click to drag points.
If you move the mouse over a point p, the edges of which p is the k-th nearest neighbour are highlighted. Rolling over a vertex of the diagram will mark
the (at least three) k-th nearest neighbours of this point light green and all points that are closer (if k is locked) or further away (if n-k is locked)
in dark green.
Adjust the order k of the diagram with the slider or by typing the desired value in the respective textbox. Admissible values lie in the range between 1 and
n-1, where n is the number of points.
You can choose between the options "lock k" and "lock n-k". In the first case, the order k of the diagram will be held constant (if possible) as you add or remove
points; you get "near" diagrams. Otherwise, k will be increased as you add a point and decreased when you remove one, so n-k is kept constant. This yields
as sequence of "far" diagrams.
Clicking on the "clear" button removes all points
The applet implements an algorithm that requires O(k(n-k)nlogn) time to create a diagram from scratch. Adding, removing, and particularly dragging
a point may be significanlty faster, though. The agorithm works differently in the "lock k" and "lock n-k" modes. In the first case, it keeps
a record of an edge's or node's k nearest neigbours. Upon an update, only the parts of the diagram for which the set of the k nearest neighbours is affected
need to be newly created. Conversely, computations are based on the n-k furthest neighbours for "lock n-k". So generally, you should expect the algorithm to be
faster for small k in "lock k" mode and for small n-k in "lock n-k" mode.
In contrast to the usual convention, the algorithm counts the ends of unbounded edges as voronoi vertices; rays pointing in the same direction end at a common vertex
(this ensures that the diagram is always connected). So don't be confused by the number of vertices reported.
Download
The download link leads to a JAR file, which is a Java program packaged for easy sharing and execution. You should be able to run
Voronoi.jar directly from your desktop. If you want to execute it from the command line for some reason, type:
java Voronoi.jar
If this does not work, you either don't have Java installed or you are using an outdated version. You can download the current
version of Java from
Oracle.
 | Voronoi.jar | Higher Order Voronoi Diagrams - Demonstration Program (Java application) |
To find out about higher order Voronoi diagrams (or Voronoi diagrams in general), you may want to have a look at one of the following books and articles:
- Aurenhammer, F. (1991): "Voronoi Diagrams - A Survey of a Fundamental Geometric Data Structure," ACM Computing Surveys, Vol. 23(3), 345-405.
- Aurenhammer, F. und R. Klein (1996): "Voronoi Diagrams," FernUniversität Hagen Informatik-Berichte Nr. 196.
- Lee, D.-T. (1982): "On k-Nearest Neighbor Voronoi Diagrams in the Plane," IEEE Transactions on Computers, Vol. C-31(6), 478-487.
- Okabe, A. u.a. (1999): "Spatial Tessellations: Concepts and Applications of Voronoi Diagrams," John Wiley & Sons, Chichester u.a.
- Preparata, F.P. und M.I. Shamos (1993): "Computational Geometry. An Introduction," 5th corr. print., Springer, New York.
Written by Andreas Pollak. Version 1.1, © 2007-2019
This program is part of my diploma thesis in computer science at
FernUniversität Hagen, Lehrgebiet Kooperative Systeme,
supervised by Dr. Christian Icking.